A Partner for Digital Transformation

Infosfera not only provides technological tools but also accompanies companies in a structured digital transformation journey.

Banner image
feature image

With Infosfera: Innovation that Transforms

The mission of Infosfera S.r.l.s. is to support micro, small, and medium-sized enterprises (mSMEs) in their journey of innovation and growth by providing advanced technological tools, personalized consulting, and recognized methodologies to manage innovation systematically and sustainably.

Infosfera positions itself as a strategic ally to improve business management, optimize processes, and create lasting value, helping companies successfully respond to global challenges.

A distinctive element of Infosfera’s mission is its integration into an innovation ecosystem, formed by a network of strategic partners and membership in technology clusters, universities, and research centers. This ecosystem enriches the added value offered to clients by promoting the sharing of expertise, access to cutting-edge technologies, and the development of solutions designed to anticipate market needs and improve competitiveness. Thanks to this synergy, Infosfera not only provides tools and strategies but also guarantees integrated and innovative support to guide companies towards the future.

feature image

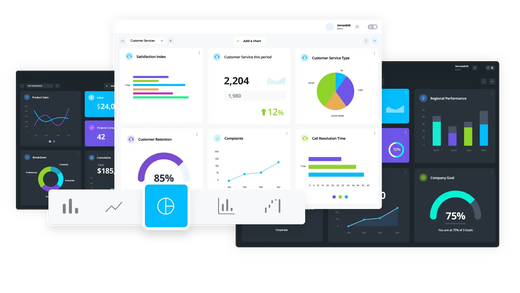
Dashboard for KPI and OKR: Tools for Strategic Decisions

To create these dashboards, Infosfera uses AI and Business Intelligence (BI) platforms such as Power BI, Metabase, Salesforce, and other solutions selected based on each client’s specific needs. The dashboards not only centralize data but also transform it into strategic information useful for improving the decision-making process.

  • Visualize key business performance indicators.
  • Analyze data from heterogeneous systems such as ERP, CRM, etc.
  • Support strategic decisions with reliable analysis and forecasts.
feature image

Process Optimization and Reengineering

Infosfera supports companies in process reengineering through Business Process Reengineering (BPR) and advanced methodologies for designing document and information flows. The approach includes an in-depth analysis of existing processes to identify inefficiencies, strategic redesign based on KPIs and OKRs, and workflow automation to optimize resources and reduce costs. Integrated solutions improve operational efficiency, document management, and security, ensuring regulatory compliance. Infosfera implements advanced technological systems to align processes with business objectives, increasing competitiveness, agility, and the ability to respond to market challenges in a sustainable and innovative way.

Some Use Cases

Situations encountered by Infosfera in various scenarios

KPI/OKR Management Dashboard for a Precision Workshop

A mechanical engineering company needed a system to monitor processing times, costs, quality, and the use of human and machine resources.

The goal was to integrate data from estimates, production, and invoicing to improve efficiency and profitability.

Infosfera developed a KPI/OKR management dashboard that centralizes data from:

  1. Quotation System: to compare estimated and actual costs.
  2. Work Orders: to monitor the progress of production phases.
  3. Control Sheets: to ensure the quality of each produced batch.
  4. Human Resources Management: to plan shifts and verify optimal personnel utilization.
  5. Machine Monitoring: to control efficiency, usage times, and unplanned downtimes.

Main KPIs: completion times, cost deviation, machine utilization, contribution margin, and delivery punctuality.

HLS (High-Level Steps) Flow Used

  1. Requirements Gathering: analysis of needs and definition of KPI/OKR objectives.
  2. Design: data integration and functional design.
  3. Development: back-end and front-end implementation.
  4. Testing & Deployment: technical verification and user training.
  5. Monitoring: optimizations based on feedback.

Management Dashboard for LAP/NSG in a Local Health Authority

A Local Health Authority implemented a Dashboard to monitor Assistance Levels (LAP) and New Guarantee System (NSG) indicators.

The goal was to ensure the quality of healthcare services, validate reports from contracted doctors, and improve transparency and administrative control.

Focus on LAP and NSG

  • LAP: Define minimum standards of healthcare services for territorial uniformity.
  • NSG: Evaluate the quality of LAP through indicators such as waiting times and clinical outcomes.

The dashboard integrates these systems to monitor deviations from targets and areas for improvement.

Solution

The platform centralizes clinical and administrative data, allowing:

  1. Real-time monitoring of clinical activities compared to LAP.
  2. Measurement of NSG indicators for corrective actions.
  3. Automated validation of costs and reports with compliant reports.

Management Dashboard for a Business Services Company

In 2023, a business services company requested a Management Dashboard to analyze financial data, manage subsidized finance projects, and support hiring processes.

The fragmentation of information (ERP systems, Excel, recruiting platforms) hindered timely and quality consulting. This fragmentation made the phases of financial consulting and HR support (hiring management) slow and unstructured, hindering the ability to offer timely and quality recommendations to clients.

Main Objectives

  • Centralize data from accounting, project management, and recruiting.
  • Monitor financial KPIs/OKRs (cash flow, ROI) and CV quality.
  • Automate the management of calls for proposals and candidates.

Solution

The Dashboard integrates modules for financial statements, investments, subsidized finance, and hiring, with notifications on deadlines, CV updates, and financial deviations. Data is processed in a centralized data warehouse with a responsive interface.

Results

  • 40% reduction in analysis time.
  • Better hiring management, reducing time-to-hire by 20%.
  • Greater transparency and strategic precision.

Management Dashboard for a Municipality Oriented to the 2030 Agenda

Monitoring Innovation and Sustainability indicators, inspired by the SDG Index & Dashboards Report

The objectives included defining KPIs and OKRs to measure sustainability, innovation, and inclusion, inspired by the SDG Index & Dashboards Report. The initial situation showed fragmented data management across sectors, hindering planning and transparency.

Objectives

  • Translate the SDGs into local actions and clearly communicate them to citizens.
  • Integrate environmental, social, and economic data into a single platform.
  • Provide a decision-making dashboard for the mayor and councilors.
  • Promote transparency and public engagement.

Solution

The thematic dashboard integrates KPIs such as CO₂ reduction, waste separation, and service digitization. With API connectors, it centralizes data from internal and external sources and offers differentiated access via desktop and mobile.

Results

  • Better internal coordination between departments.
  • Reduced analysis time thanks to centralized data.
  • Transparency towards citizens with real-time public data.
  • Strategic alignment with the SDGs, increasing funding opportunities.

Benefits

Data-driven governance, improved reporting, and greater citizen participation, with prospects for continuous evolution through machine learning and predictive analysis.